I’ve done something similar with PID and I found the best way to debug it is to log everything to the serial output so you can see what is going on.
I also log to CSV format so I can create graphs in a spread sheet. For example, here is code I’ve used:
//----------------------------------------
//
//----------------------------------------

void resetPID()
{
  pid_total_lticks = 0;
  pid_total_rticks = 0;
  pid_lastErr = 0;
  pid_sumErrs = 0;
  adjustLMotor = adjustRMotor = 0;
  updateMotors();
  clear_ticks();
  pid_time = 0;
  #if CSV_OUTPUT && PID_INFO
  Serial.print("PID Reset: System Bias = ");
  Serial.println(SYSTEM_BIAS);
  Serial.println("Time, Interval, Left Ticks, Right Ticks, Error, Sum Erros, Adjust, Left, Adjust Right");
  #endif
}

//----------------------------------------
//
//----------------------------------------

void driveStraight()
{
  static int16_t lticks = 0, rticks = 0;
  static uint16_t ms = 0;
  int16_t dlticks, drticks, diff;
  int32_t delta;
  uint16_t dms;

  get_ticks_since_last( &dlticks, &drticks, &dms);

  lticks += dlticks;
  rticks += drticks;
  pid_total_lticks += dlticks;
  pid_total_rticks += drticks;
  ms += dms;
  pid_time += dms;

  if ( ms > 200 )
  {
    int16_t rdir = rticks < 0 ? -1 : 1;
    int16_t ldir = lticks < 0 ? -1 : 1;

    // make the values positive
    lticks *= ldir;
    rticks *= rdir;

    int16_t bias = (rticks*SYSTEM_BIAS)/10000L;
    diff = ((lticks  - rticks + bias )*100L)/ms;

    // we want the difference to be 0

    // track the integral
    pid_sumErrs += diff;

    // get the differential
    delta = (int32_t) (diff - pid_lastErr);

    int16_t P = (int16_t) ((Kp*((int32_t)diff) + Ki*((int32_t)pid_sumErrs) + (Kd*delta))/1000L);

    pid_lastErr = diff;

    // a positive error means the left motor is
    // turning more than the right so adjust
    // each motor accordingly
    int16_t adjust = (P>>1);
    adjustLMotor -= adjust*ldir;
    adjustRMotor += adjust*rdir;

    // Put a limit on the total adjustment in case PID gets out of control
    constrain( adjustLMotor, -MAX_ADJUSTMENT, MAX_ADJUSTMENT);
    constrain( adjustRMotor, -MAX_ADJUSTMENT, MAX_ADJUSTMENT);

    #if PID_INFO
      #if CSV_OUTPUT
        Serial.print(pid_time); Serial.print(", ");
        Serial.print(ms); Serial.print(", ");
        Serial.print(lticks); Serial.print(", ");
        Serial.print(rticks); Serial.print(", ");
        Serial.print(diff); Serial.print(", ");
        Serial.print(pid_sumErrs); Serial.print(", ");
        Serial.print(adjustLMotor); Serial.print(", ");
        Serial.print(adjustRMotor);
        Serial.println();
    #else
        Serial.print("DIFF = ");
        Serial.print(diff);
        Serial.print(" ERR = ");
        Serial.print(pid_sumErrs);
        Serial.print(" ADJ = (");
        Serial.print(adjustLMotor);
        Serial.print(", ");
        Serial.print(adjustRMotor);
        Serial.println(")");
      #endif
    #endif
    updateMotors();
    lticks = 0;
    rticks = 0;
    ms = 0;
  }
}
Pretty simple.
You can see some of the graphs I was able to produced here : wp.me/p493sy-dQ
Was very helpful for figuring out my bugs.
Even if your PID control is working properly I think there might be an issue with the compass. I’ve only played with the Zumo compass a little but I noticed that the readings are greatly effected by the indoor environment. I would create a sketch that just continually prints the heading and manually move the bot in straight lines to see if the heading stays constant.
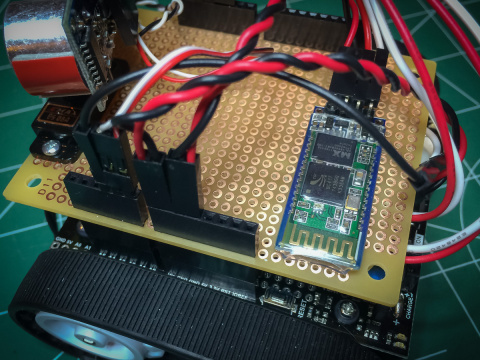
BTW, I recommend getting a bluetooth module if you don’t already have one. It’s great not having to tether your laptop to the bot when trying to collect data. You can get them for around $10 on amazon.